1

I was reading the global warming article on the Japanese wikipedia and got stuck on this phrase

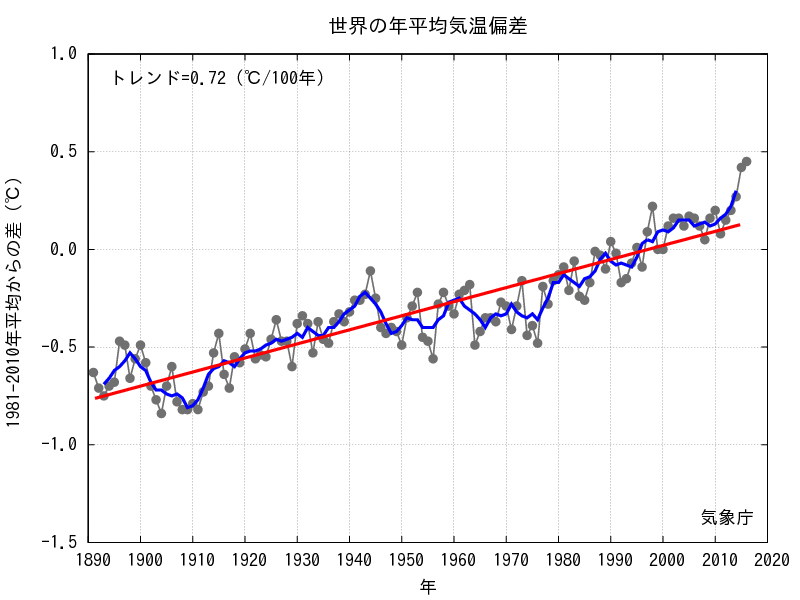
世界の年平均気温の偏差の経年変化

I looked up the last two words individually, which lead me to an interpretation of: 'world change [i.e. increase] of average temperature deviation over the years'. Is this correct?

I think, from what I've understood in my previous reading, temperature deviation is the difference from a baseline average temperature [pre-1950's from memory]. But as this is the first time I've encountered 偏差 and 経年変化, I'm worried I might be jumping the gun.

Any help would be appreciated. Thanks :-)

Edit: I found out later the baseline temperature is the 1981-2010 average, not that of 1891-1950, as I originally presumed. The caption in the article doesn't explicitly identify this average, which led to a lot of confusion on my part. It would have been helpful if the Japanese article didn't leave this information out.

8
  • It's not "pre-warming average", it is an average from a period measurements were taken (1891-2010) and a yearly deviation from this average. It's not what statistical deviation is most commonly used for, but the caption is coherent. Maybe there is a better technical term, but that's a question for CrossValidation or English.SE.
    – macraf
    Commented Oct 25, 2017 at 2:19
  • Sorry, I meant that the graph uses the average before a certain date to establish a baseline average temperature, and this is used to determine a deviation of an annual average temperature after that date. My wording was clumsy. My confusion stemmed from having two similar next to each other: 偏差 and 変化.
    – Robert
    Commented Oct 25, 2017 at 2:42
  • No, it doesn't use the average before a certain date to show deviation values after that date. Please read my previous comment again.
    – macraf
    Commented Oct 25, 2017 at 2:47
  • You're right, sorry.
    – Robert
    Commented Oct 25, 2017 at 2:55
  • 1
    I think 経年変化 is a trend which is estimated by the data. I think annual change sounds like change in time or change in deviation from previous year.
    – user25382
    Commented Oct 26, 2017 at 12:19

3 Answers 3

4

[①世界]の[②年平均気温]の[③偏差]の[④経年変化]

Just reverse the order and you can get the basic literal translation:

[④annual change] of [③the deviation] of [②the annual average temperature] of [①the world]

Technical phrases can usually be translated rather literally. I don't think "world change" is a good translation although it may mean something.

偏差 roughly means "some difference from some representative value (mean, median, mode, etc) of the population". It's often a shorter synonym for 標準偏差 (standard deviation), but it can be a simple arithmetic difference from some average value. If you are seeing this, the "difference" is simple arithmetic difference, and the baseline "representative value" is "世界の年平均気温の1981〜2010年平均", the mean of the world temperature in 1981–2010.

経年変化 is just "annual change" "change over the years".

32
  • 2
    The last sentence spoils (effectively negates) the whole answer.
    – macraf
    Commented Oct 25, 2017 at 2:58
  • 2
    I mean "yearly shift" and "inner-annual change". It's not what the graph shows. It shows data distribution throughout/over the years. But there is no year-to-year relation.
    – macraf
    Commented Oct 25, 2017 at 3:02
  • 1
    I think annual change might be better (the graph shows how the average changes from year to year). Or perhaps, showing how the annual average temperature has changed over the entire period.
    – Robert
    Commented Oct 25, 2017 at 3:09
  • 1
    Jisho has 'change over the years'. That seems perfect to me.
    – Robert
    Commented Oct 25, 2017 at 3:15
  • 1
    @naruto Jisho's definition change over the years fits the bill. Such a phrase implies a time scale of years, not months etc.
    – Robert
    Commented Oct 25, 2017 at 4:00
0

English

世界の年平均気温の偏差の経年変化

The above phrase means as a whole "the transition of the average temperature in the world." To put it in detail, "it is a plot of the world's annual average temperature (one representative point per year) for a hundred and decades and shows the transition of the temperature as a graph."
However, since we want to see only the state of change, they don't use the real temperatures, but a graph that moves the zero point of the Y-coordinate using the appropriate average temperature value (average value of 1981-2010).
In short, "it is what makes only the change (ripple) of the temperature transition easy to see, where the unit of X-coordinate plot is year."

The words with "偏差" and "経年変化" are somewhat exaggerated and have an atmosphere of mathematical terms, but they don't have the particularly difficult meanings, which can be rewritten in easier words as mentioned above.

They already use the word "平均気温" in this phrase, so they didn't need to use the word with "経変化" where "年" appears again, but they used it. So I think that the respondents to this question and people who made comments were confused and a lot of comments were posted endlessly.

For the interpretation other than "経年変化", naruto seems to be correct (+1), and for "経年変化", macraf seem to be correct (+1 for the comment) from the beginning.

日本語

世界の年平均気温の偏差の経年変化

上記の意味は、
基本的には世界の平均気温の推移です。少し詳しく言うと、世界の1年間の平均気温(1年に1つの代表点)を百数十年分プロットしてグラフにして気温の推移/変化を表したもの。但し、変化の様子だけを見たいので実気温ではなく、適切な平均気温値(1981-2010の平均値)を用いて座標移動をしたグラフです。要するに気温推移の変化分(リップル)だけを見やすくしたものです。プロットの単位は年。

「偏差」とか「経年変化」という意味はなんだか大げさで数学的な匂いはしますが簡単に言い換えることができる上記のように特にむずかしい意味を持っていません。もっと簡単な普通の言葉に言い換えられそうです。

既に、「平均気温」と言ってますので「年」が再び登場する「経変化」という言葉を使ったので皆さんが混乱し、大量のコメントが往来しているのだと思います。

「経年変化」以外の解釈はnarutoさん(+1)、「経年変化」の理解は、macrafさん(コメントに+1)が最初から合っているように思います。

0

I think probably the confusions arise from this is discrete time-intervals and they are fixing the deviation value. Therefore, I think "Annual change" which is the translation of 経年変化 sounds unfit since they are not really monitoring the phenomena all the time but just pick up the value they already collected and plot it on the sheet. However, Naruto already picking up the term "change over the years" for 経年変化, I think it can avoid the confusion.

I think this is called Time-Series Analysis. They have data of average temperatures and have prepared deviations and want to analyse the model(ex:find a trend of the data,how much volcano eruption affects the data)

Horizontal axis is arranged for a discrete equal time intervals by 1 year measurement. Vertical axis is arranged for a deviation value calculated for each year. Then, they prepared the regression line for a trend as below.

enter image description here

Reference:

長期変化傾向(トレンド)の解説

http://www.data.jma.go.jp/cpdinfo/temp/trend.html

CSV データ 世界の年平均気温

http://www.data.jma.go.jp/cpdinfo/temp/list/an_wld.html

Python Code

import pandas as pd import csv import pprint import numpy as np import matplotlib.pyplot as plt df=pd.read_csv('\an_wld.csv', sep=',',header=None) df.values x = df[0] y = df1 z = np.polyfit(x, y, 1) p = np.poly1d(z) plt.plot(x, y, marker = "o") xp = np.linspace(1890, 2016, 120) plt.plot(xp, p(xp)) plt.show()

2
  • annual change が良くないということ自体はmacrafさんと同じ意見ですが、その理由がかなり異なっているようです。macrafさんは「annual changeとは"対前年比"(ひとつ前の年との差分)のことのみを指すから」とおっしゃっているようです。
    – naruto
    Commented Oct 29, 2017 at 8:03
  • @naruto Macrafさんはannual changeを統計で前年のデータと比べて、どの程度数値が変わったか話している訳ではない、僕は気象庁が気象データを気象予報か何かの為に一年中データを集めているに聞こえるという事だと思います。まあ、robertさんが他の人が納得できると思うと言えばannual changeを使っても良いと思います。ただ僕はannual value,annual data、もしくは naruto さんの言うようにchange over years.
    – user25382
    Commented Oct 29, 2017 at 9:14

You must log in to answer this question.

Not the answer you're looking for? Browse other questions tagged .